
In the modern age when Microsoft Excel lives on nearly every computer, and programs like Qlik® use advanced analytics to draw up graphical representations of big data, it’s easy for users to explore large data sets for exciting correlations and discoveries.
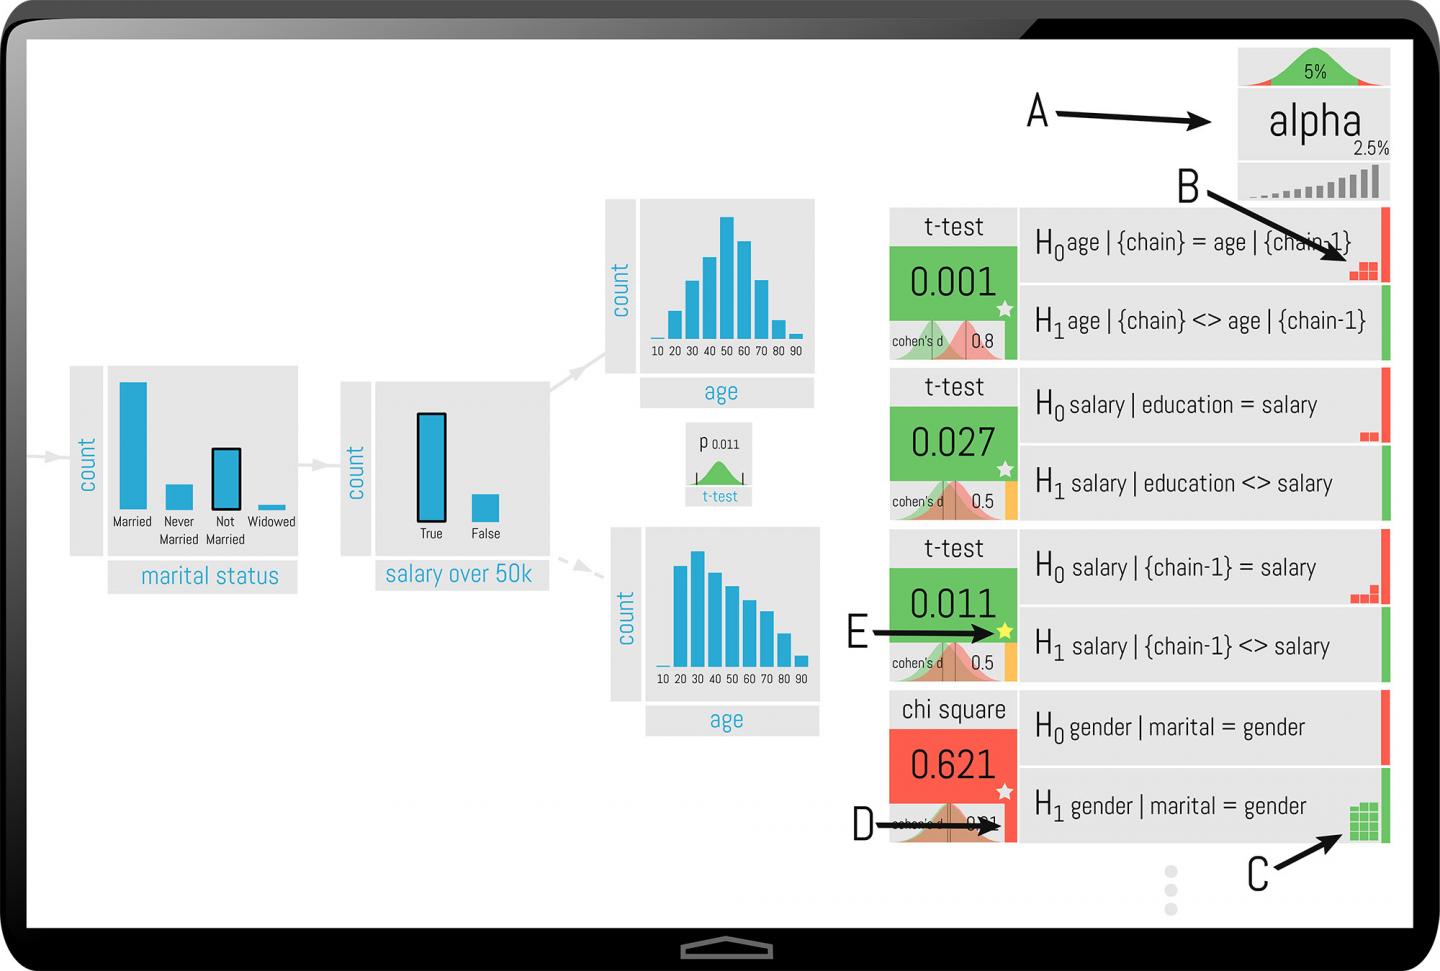 Visualizations in green represent a statistically significant finding. Findings in red are on “shaky statistical ground.” (Source: Kraska Lab/Brown University)Unfortunately, as any statistician will tell you, the ability to ask unending questions of the same data series increases the chance for false discoveries. This idea is termed the “multiple hypothesis error.”
Luckily for those of us enamored with modern data visualization software, a team of researchers from Brown University may be on their way to resolving this error.
Tim Kraska, an assistant professor of computer science at Brown and a co-author of the research, describes the error. He explains, “these tools make it so easy to query data. You can test 100 hypotheses in an hour using these visualization tools. Without correcting for multiple hypothesis error, the chances are very good that you’ll come across a correlation that’s completely bogus.”
The researchers presented a new program called QUDE at the Association for Computing Machinery’s Special Interest Group on Management of Data (SIGMOD) 2017 conference in Chicago. QUDE adds real-time statistical safeguards to interactive data exploration systems.
The program highlights figures and feedback green or red to indicate their statistical significance or potential concern regarding the correlation.
Ordinarily, insignificant correlations would be caught by well-established protocols in statistics. The problem is, most of these techniques are used after-the-fact, and with visualization software, more and more users are not trained in statistics, they merely rely on the program to present them with methodologies.
“We don’t want to wait until the end of a session to tell people if their results are valid,” says Eli Upfal, a computer science professor at Brown and research co-author. Instead, Upfal explains, “you have a budget of how much false discovery risk you can take, and we update that budget in real time as a user interacts with the data.”
While this program, like any program, cannot guarantee complete accuracy, it’s a solid step in the direction for amateur statisticians.